Showing posts with label Gold. Show all posts

Monday, March 25, 2024

Broken Money

The subtitle is Why Our Financial System is Failing Us and How We Can Make it Better, and the author is Lyn Alden (2023).

I feel like I have read books like this one before, which deconstruct the problems with a fiat monetary system and the issues of inflation / rampant money creation.  That said, the author does a nice job of supplementing the traditional view.

-The story over history is that hard money eventually wins out over weaker money.  Until now.  And the reason that fiat currencies won out in the recent era is because telecommunication systems introduced speed as a variable to the competition.  Gold/commodities inherently take longer to transport and authenticate, an inconvenience in the digital age.

-The short-term view that every politician has to take means that the problems of perpetual debt growth can never really be addressed.  It is not a problem that can be attributed to one politician or party.

-The reason that 2008 did not cause inflation was because the bailouts went to the banks and the average person did not have more money.  But the expansion of broad money during the pandemic did end up in the hands of average people, which meant that more money was chasing the same amount of goods and services.

-Bitcoin represents a solution to the speed gap between transactions and settlement.  And it has the added virtue of maintaining characteristics which resemble hard money (decentralized, no one else’s liability, high stock-to-flow ratio).

Tuesday, June 18, 2019

Crypto vs. Gold

I thought this analysis by Raoul Pal in a recent Real Vision interview was interesting:

And also, if you think about the set of opportunities that baby boomers had when they were in their 20s, right, they had the whole demographic wave in front of them. And they had equities by 1982. Repeat of seven in the S&P. They had interest rates at 15, 16%. So, they had the best setup in history to accumulate wealth, right? Nobody's ever been given that before. You cut to the millennial now, they've got the most expensive stock market in all history. They've got bond market that yields nothing. They've got real estate that is incredibly expensive that they can't buy. They have the absolute inverse of what the baby boomers have then. They have one thing, and that is crypto. Right. If there's one thing on a [30-year] pension retirement horizon that has the probability of going to a huge number, it's this area. That's the way I think of it. Yes, there's a whole bunch of other investments and you could do VC and stuff like that. But if there's one option bet that could pay off a thousand x, it's this. And so, if you're a millennial, you forget gold, because yeah, sure, gold may double. It may double again. But it's not going to have the same performance over time that cryptocurrency could if you get the right bets. Yeah, that's how I'm thinking of it.

Thursday, November 24, 2016

The Holy Grail of Macroeconomics

The subtitle is Lessons from Japan’s Great Recession and the author is Richard Koo (2009).

After seeing the author interviewed on RealVision TV, I decided to pick up his book. He is an economist most well-known for formulating the concept of a balance sheet recession, and then convincingly ascribing it to be the cause of both Japan’s lost decades and America’s Great Depression. What it describes is in the aftermath of a large bubble bursting, balance sheets are damaged – and whereas all classical, mainstream economists assume that economic actors are always profit-maximizing, Koo understands that borrowers prioritize paying down debt in these moments, not further borrowing, and so monetary stimulus holds no weight to turn the economy around until balance sheets are repaired. Therefore, the answer must be fiscal policy to maintain aggregate demand and to avoid a deflationary gap. The government must be the borrower of last resort to keep the economy on a steady plane during these periods.

What are the implications and particular nuances of this theory relative to anything else that gets tossed around?

For starters, it tells us that quantitative easing will not create economic growth, because low interest rates are not an impetus to borrow and invest when the priority is simply to pay down debt. Koo implies that the current global recession is also a balance sheet recession, which might explain why QE has not had the consequences that were hoped for. But I am not sure that his theory offers a complete explanation – specifically, it sure seems like QE has led to another bubble in financial assets, and nowhere do I see an explanation in his theory for why that is happening. Unless we aren’t really dealing with a balance sheet recession.

He distinguishes himself from Keynes in explaining the liquidity trap – which is the effect of zero rates causing bonds and cash to be substitutes for one another. But, Keynes still assumed that economic actors were profit maximizers, and therefore identified the logjam in borrowing to be with the lenders rather than the borrowers. More generally, in contrasting himself to the acolytes of Keynes, Koo understands that the fiscal policy solution is only appropriate for a downturn that qualifies as a balance sheet recession, not just any and all recessions, otherwise government borrowing will crowd out private investors and cause inflation and rates to rise.

With respect to gold, and the idea that the gold standard exacerbated the great depression by preventing the creation of needed reserves, Koo’s theory obviously suggests that where there are no borrowers that the creation of new gold-backed reserves was not the problem – the demand for funds was not there. As a corollary of that point, Koo acknowledges that the Central Bank system requires confidence, and even though the gold standard has been eliminated, it is important that central bankers operate as if such a restraint was still in place.

Overall, another tool and theory to understand the world.

Sunday, April 27, 2014

Gold Chart

Inverse head and shoulders?  Cup and handle?  Whatever you want to call it, it sure looks bullish...

Saturday, April 26, 2014

The Death of Money

The subtitle is The Coming Collapse of the International Monetary System and the author is James Rickards (2014).

From the same writer as Currency Wars, the subtitle should give it away – he looks at the dynamics at play that will undermine the existing structure, specifically dollar supremacy. All of it presages financial war, a state where efficient markets theory and rational behavior can be thrown out the window. Unfortunately, politicians, central bankers and the like rely on theories and models that in no way reflect the complexity theory that governs the real world – in part, because a complex world can seem noncritical up until the moment that all hell breaks loose. Hence the reason that so many “experts” struggle to see crises in advance. And this sense of confidence in their understanding of the world is what encourages these central planners to take a top-down approach of managing and fine-tuning all elements of the economy. All leading to their eventual downfall. Beyond these larger ideas, though, Rickards provides interesting analysis on a few specific topics.

The first is an explanation of why so many “Euroskeptics”, expecting the currency to combust any day now, have been wrong. First, in a world where the U.S. has been forcing a weak dollar policy, it should not come as a shock that the Euro would gain relative strength. Second, the currency’s strength is more related to capital flows and central bank policy, and is not at the mercy of a particular bond default – so the issues with Greek and Spanish bonds does not predict with any certainty what might happen to the Euro. Third, even as export competitiveness went down in Europe, the U.S. and China were involved in swaps with the ECB and sending money into Europe in the form of FDI, thereby supporting the currency. Fourth, there exists a belief in Keynesian theory, specifically in the notion of sticky wages and that inflation is needed to lower real unit labor costs and to avoid a liquidity trap. Well, Europe has seen wages go down, and the result has been a lack of need or desire to break free from the Euro and return to national currencies that encouraged inflation and corruption. Finally, as the Euro is a political project, the will to stick with it is much greater than many analysts realize. I don’t necessarily subscribe to all these points, but feel they are worth highlighting.

The second subject is the way to think about Debt-to-GDP ratios. In the end, what is most critical is not the absolute level of that ratio, but its trend towards sustainability. Which is to say that the use of debt must be for productive ends, thereby creating economic output (net of interest expense) that is measurably in excess of the primary deficit. For countries like the U.S. and Japan, the trend is not their friend – especially as the use of debt by government in the QE and Abenomics programs is for non-productive ends.

As a corollary of that discussion, Rickards brings up a topic that has intrigued me for a while and generated thoughts in other posts on this site – namely, about a true understanding of the period referred to as the “Golden Age of Keynesianism” following WW2 until 1971. I have said that a Minsky analysis of that time would reveal, simply, that the trend towards reckless and speculative behavior was slowed only because the Depression and war had led to a very high level of savings in this country that took a longer time to burn through – the Keynesians simply try to take credit where no credit is due. Rickards’ view is similar – that financial repression was allowed to go on for a longer period of time before inflation took off because so many were living with recent memories of the Depression and wartime controls and rationing, thus keeping a very large portion of their money in banks.

The final topic is around why deflation is so problematic – from the point of view of politicians and central bankers. First, under deflation, the government debt burden becomes greater in real terms, making it more difficult to repay. Second, as an off-shoot of the first, the Debt-to-GDP ratio would move against governments in such times (since debts would go up, but economic growth would go down), thereby leading to higher interest rates and even larger deficits. Third, as deflation causes the real burden of debt to go up, it stands to benefit creditors – until defaults go up as a result, and bank failures follow. Fourth, real wages go up even as nominal wages stay constant – and from a tax collection standpoint, the government is not able to monetize that benefit. Inflation is the easy way, even if it just delays the day of reckoning. All worth keeping in mind, I think , any time you hear an economist or politician prattle on.

As a last anecdote, the author speculates that $9,000 per ounce for gold is closer to fair value given the global money supply.

Tuesday, April 22, 2014

Setting Sun

I pay close attention to Japan, so this Bloomberg article about the widening trade deficit is interesting. I liked this quote from economist Junko Nishioka at RBS: “In spite of the continued weaker yen, the performance of Japanese exporters is quite weak compared to competitors like Korea or Taiwan.”

This next one from Bloomberg highlights how inflation in Japan has picked up, but consumer confidence has dropped, because there has been no rise in wages to offset the inflation. So much for inflationary “benefits”.

Things don’t look so good for Shinzo.

Also, thought the chart below from the New York Sun tells a worthwhile story. It looks at income inequality in the U.S. – interesting what coincides with the spike up that starts in 1971…

Friday, April 11, 2014

Next in the queue...

Gold.

After tackling the currencies earlier, we now look at my favorite metal from the table of elements. I have never been a guy who focused on Fibonacci retracements, but, holy moly, does the gold chart confirm that analysis lately. First, here’s the chart (using GLD as a proxy):


Let me explain what’s going on. I have connected the trough of $114.46 on 12/31/13 with the peak of $133.69 on 3/14/14 – represented by the white, hashed line. Off of that, I have added Fibonacci fan lines (the dark blue lines), which measure the important Fibonacci retracement levels of 38.2%, 50.0%, 61.8% and 100.0%. What you’ll observe is that the correction from March 14th until April 1st matches perfectly with the 38.2% level. More specifically, the green arrow highlights where the 38.2% level lies – and in drawing a horizontal line from that point, you’ll see that the correction ended exactly at that price.

Pretty remarkable. And probably a decent sign that the near-term correction in gold was over.

As an afterthought, the light blue lines show the Fibonacci retracement levels for the move up off the April 1st low, and they suggest that we could be getting close to the next short-term pause in the price action.

Thursday, January 9, 2014

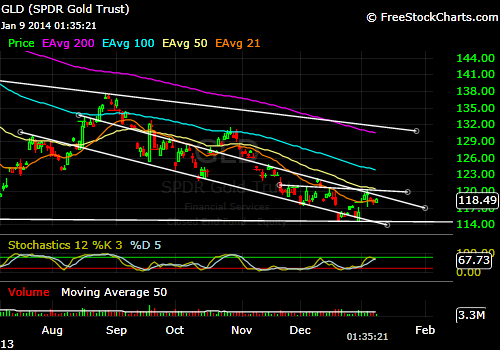
Gold Update

I haven’t dwelled on the chart for gold in a while, so here goes…

What I have provided below is the last 6 months for GLD. I see two things that are worth paying attention to. First, observe the downward sloping channel that dates back to August, 2013. It has been a decent gauge for where to buy and sell, and just this past week operated as overhead resistance on price. Second, I drew in a short horizontal line that starts in late November, 2013. It appears to function as the neckline for an inverse head-and-shoulders – if I’m right, then what we need to watch for in coming days is price stabilization around these levels ($117 to $119) and then an attempt to retest the $120 level. If it were to break through, the move should take us up to the $125 level or so – all of which would be significant because of the bullish inverse head-and-shoulders being completed, but also because it would mean a breakout from the channel discussed earlier.

If the question is where do I stand? I am agnostic, but constructive on where price is headed. You know what to look at.

Wednesday, January 1, 2014

2014

I had to go back and remind myself of the quick list of predictions that I made for 2013. Overall, not a stellar job. Gold is still in a bull market, but it also suffered horribly over the last 12 months. Japan showed the early signs of what I deem to be big problems, but there was no obvious combustion. There was a taper, despite my best guess, and the unemployment rate moved lower (even if everyone now knows it is a bad measure of success). But, shorting the yen was definitely a winner.

On to 2014…

I think the same themes that I focused on then are in play. We have just moved 12 months closer to the point when everyone else will start to realize it.

-Japan keeps approving more “stimulus” because Abenomics does not do anything except weaken the yen and create cost-push inflation. Wages are stagnant.

-Gold has tested the 2013 low a few times. We’ll know shortly, I think, whether that will hold or $1,000 to $1,100 is the landing spot. Either way, a good value exists in the metal and the better mining stocks. Still,  I anticipate that 2014 will be much more generous to the gold bulls than the past two years have been.

-The 10-year closed above 3.00%. That can’t make the Fed happy and is a clear measure of how the bond market is no longer cooperating. Higher rates are bad for housing prices, the stock market, budget deficits, profit margins and all the things that create a desired wealth effect.  So, with all of it, I don’t think the Taper is the thing.

-Finally, on a personal note, I expect my endeavors in real estate to evolve.

A happy and healthy new year to all.

Friday, December 20, 2013

Links

I think Alasdair Macleod provides an interesting take on the taper announcement. To wit:

-The reduction was a token amount and the fact that it sliced away at MBS and Treasuries equally suggests that the decision was one to “pluck a figure out of the air”

-Even if the QE policy was reduced in scope, the commitment to ZIRP remains. And, therefore, implicitly a commitment to providing as much liquidity as needed to keep rates suppressed. Doesn’t that make the two policy announcements a bit contradictory? Or, better yet, QE meaningless in the context of whether or not the Fed must continue to be out in the market buying and selling lots of securities?

Here’s another interesting link – the gold ain’t there.

Speaking of Obamacare, one more requirement has been waved by fiat – namely, the deadline for people who had policies cancelled to sign up or else endure a penalty. This thing is becoming the disaster that keeps on giving. But, the best part is the closing line of a very snarky article: “And the punchline: With only days before the Monday deadline to sign up for coverage that starts Jan. 1, insurers are facing a much smaller, and sicker, pool of customers than hoped for. Like we said: anything that can go wrong... oh look, over there, the Stalingrad & Propaganda 500 just hit a new all time high!”

In Mark Hanson’s latest, he lays to waste the idea that housing is more affordable now than it was during the bubble years since rates are lower and prices are still beneath the highs. The reality is that the exotic financing of yesteryear that allowed people to buy with no money down and no income is gone. Today, the great majority are doing 30-year fixed terms, and the monthly payments are about as high as they have ever been. Factor in at least 20% down, and you should ignore the prior highs on Case-Schiller as to where things could go.

Tuesday, October 22, 2013

The Long Game

I want to expand on my last post because I finally feel like something clicked with respect to gold and where it’s headed. Let’s review:

-In a post on October 11th, I looked at gold on a daily chart (each candlestick represents one day’s price action). My view was that a cup-and-handle was in play, with the cup spanning from early May to late August. The handle piece was still not confirmed and needed to set up in a hurry in order to be viable. But, if it happened, the overhead resistance level would be $1,420 and projected to somewhere around $1,700.

-Within that post, and acknowledging the possibility that a low was not yet in, I suggested an alternative theory that the cup was really a left shoulder and part of a larger bottoming formation that could span well into 2014. Again, the neckline would be $1,420, but the bottom had yet to be found. Still, borrowing from Jim Rogers and others who think it could go as low as $900 to $1,000, the projected target would be something like $1,800 to $1,900.

-Enter today’s thinking. On an even longer time frame, where we look at price in terms of weeks instead of days, the chart is suggestive of an inverse head-and-shoulders about halfway through, this time with $1,800 as the key level of overhead resistance. But, by virtue of the larger scope, the target would be significantly higher. If the price had found a bottom at roughly $1,200, then the minimum projection would take us to $2,400. But, again, accepting Jim Rogers’ rough forecast and using $1,000 as an eventual trough, the new projected target could be at least $2,600. In this scenario, we are talking about a pattern that is apt to take another 18 to 24 months to resolve.

What am I going to do about it?

-The key is to watch the $1,420 level, which is less than $100 away as I write. A break above and I’m playing a move towards $1,700. And any pullback along the way should produce higher lows and a trend line will inevitably develop that one could to use to trade in and out. Or you might just buy some long-dated out-of-the-money calls with the break of $1,420.

-If the cup-and-handle doesn’t materialize, then we are probably headed lower. Without an instinct to where the fall would stop, $1,000 seems like as good a forecast as any, so I’m buying when we get there. Again, probably some LEAPS and I’m giving myself enough time to let the head on both the weekly and daily charts play out. I’m selling them when we get back above $1,700.

So far, either scenario seems to bring us to the same place as far as selling this initial trade.

-Once we get up to the $1,700 to $1,800 level, a correction of some depth will come as the right shoulder develops. My expectation is that the support will exist between $1,500 and $1,600. And the right shoulder itself should take 9 to 12 months to form, bottoming out somewhere in the middle of that period. And if I’m smart enough to see it, I will again consider adding to physical and LEAP positions at around that level.

-Now it’s time to see the bottoming formation complete itself. And it probably says 2015 on the calendar as that happens. But then the fireworks begin.

(Breathe.)

Obviously, this could all be moot. But, if I’m wrong, it doesn’t really matter yet, because I’m not going to do anything right now. But, if I’m right – and I kind of have to believe that if I’m convinced that the bull market will continue – then all of the above seems reasonable. And, to bring Jim Rogers back to the discussion, a cup-and-handle or an inverse head-and-shoulders, all within an even larger inverse head-and-shoulders, taking place over 3 or 4 years… well, that sure sounds like a “complicated bottoming process”.

The Longer View

Unfortunately the right side (price) got cut off, but below is gold on a weekly basis going back to June, 2011 (i.e., it includes the spike to $1,900 per ounce).

I don't have much to say, except that maybe we are halfway through the head in an inverse head-and-shoulders.  The neckline is $1,800.  The trough is $1,200.  It will probably take another a year or two to complete, but it projects to north of $2,400.  And if you marry it to my other recent analysis, which is more short-term and looks at the potential cup-and-handle that could be another inverse head-and-shoulder within the larger one on the weekly, all you're doing is setting up an even higher target.

Friday, October 11, 2013

Beatdown, Part...Oh, who the hell cares at this point?!

Another beatdown in gold today, triggered by a huge, sloppy market order. I want to believe that the tinfoil contingent is crazy, but with more and more trades like this one, that show a blatant disregard for price, it’s becoming difficult. Anyway, in the aftermath, I thought that looking at the chart would be useful. Below is a daily that takes us back to the first big dump in April.


My read is that a bullish cup-and-handle formation is on the table, but first we have to see an intermediate bottom put in here. There is not much wiggle room on that either. Around these levels is where it needs to bounce if it’s going to.

On the other hand…

Consistent with guys like Jim Rogers who think we are in for a lower low and a longer bottoming process, what looks like a cup today could become a left shoulder down the road. All of which would suggest a process of bottoming that takes us well into 2014, if not 2015. And under those circumstances, the inverse head-and-shoulders would be simply massive and speak to an incredibly powerful upside move. We would just need to show some patience.

Friday, October 4, 2013

What vs. Why

The team at Casey Research posted an interesting conversation with a technical analyst, Dominick Graziano. He was the guy who helped them to create the GLD put insurance trades that worked well for their subscribers earlier this year.

In the course of talking about all markets, gold came up of course. His view is that it remains in a significant downtrend – and, therefore, news that should be bullish simply won’t be as impactful versus what might have happened to the price in 2010. He also notes that the charts suggest that global equities entered into a secular bull market earlier this year, one that may last for several more years.

All of which brings me back to the problem that I have with TA. In looking at the “What” of price action, the charts don’t ever give you the full story. As I like to say, Enron’s chart looked great, until it didn’t. And such will be the case, in my opinion, with everything else right now. For example, it seems that there is a huge disconnect between the fundamentals of the underlying economy and stock market performance. There is also the problem of a bull market in bonds that appears to be near completion (if not over already) – and higher interest rates are not going to be good for stocks. And, lastly, if much of the stock market levitation is attributable to money-printing, which I believe, then it’s hard to have any confidence that the trend is secular and still has years to go, especially if people start to figure out how the Fed is trapped in its policies.

The fundamentals matter. Which means the “Why”. And since charts are often looking in the rearview mirror in establishing a trend, they can miss the realities distorted outside of a candlestick.

Wednesday, October 2, 2013

Gold Update

I could very well be whistling past the graveyard, but here goes an updated take on the gold chart (as is often the case, using GLD as proxy).


First thing to note is that between yesterday and today, it strongly bounced off of a shorter-term trend line that dates back to early July.  However, even though an equivalent wouldn't emerge in the actual gold chart (since it is 24 hours), the move back up today simply closed the gap in the GLD chart that yesterday’s action had created. So, obviously we need more information in order to know what it all means.

But, taking the broader view of the past 6 months (which is what the entire chart captures), you’ll notice the line drawn in that dates back to the first dump in April – and here’s where maybe I’m trying to be too cheerful – it could be interpreted as the neckline of a large inverted head-and-shoulders formation. Which would suggest that yesterday’s levels should hold and that we could expect the next move up to re-test that neckline.

At the same time, there is a sound thinking which holds that bear markets, such as the one that gold has experienced in the past two years, don’t reverse themselves in a V-shaped manner (which is what the July low would suggest). Instead, it takes time and muddling through the lower levels as a new base is formed.

Again, I don’t know. I have been wrong at most junctures. But, if it’s any consolation, the theory also holds that even the most adamant bulls begin to question themselves when the real bottom gets formed. From what I’ve been reading here and there, it kind of feels like that is starting to happen.

Tuesday, September 17, 2013

Tea Leaves

Like the moth attracted to a flame. When it comes to gold, and trying to read the chart, I can’t help myself – even though every time I offer an opinion lately, I get burnt. Be that as it may, and in spite of a just posted comment where I throw my hands in the air about what’s coming, I am going to read the squiggles.

Below you’ll find two charts: (1) gold priced in US Dollars and (2) gold priced in Japanese Yen. In both, it appears that gold is at important levels.

First up, dollars. At a bit over $1,300 per ounce, the bulls would like to see it hold, otherwise we’re probably headed back to the late-June lows. On the other hand, if it does hold, you might notice the downward sloping line that I drew in that traces back to the dump in April. Again, if the price holds, you see what could arguably be described as an inverse head-and-shoulders, which is suggestive of higher prices.

Now for the Yen. It is a bit more constructive, and I have drawn three lines that are relevant. The first captures a recent peak in early September and then heads sideways to late May. If price were to hold, you have a cup-and-handle set-up in the making. Which leads to my other doodles. The price of gold is currently hitting the intersection of two supportive trend lines. One that is moving northeast from late-June and the other which runs sideways from early-April. Since gold is not operating below these support lines (as is the case with the USD chart), it makes a stronger case for bullish price action from here.

Which leads to my pairs trade idea. Buy gold, short Yen using GLD calls and FXY puts. A thought, not a suggestion or advice.


Monday, September 16, 2013

Dog Indeed

Stock market is up a lot.  Bond yields have dropped a lot.  Basically every asset class is flying after Summers withdrew himself from consideration for the next Fed head.  Except gold.  And that makes me nervous.

Tuesday, August 27, 2013

Catching Up

Other than a quick book review, I’ve been negligent in my posting duties lately. Consider this one an effort to get current on what’s happening.

-From our original note on August 8th, when the price of gold was $1,312, the yellow metal has gone up 8.2%, in the face of declining markets everywhere else. And it seems that the momentum is back with the bulls. Not that we ever had any doubts, right?

-Syria appears to be a fiasco in the making. Stratfor offers a decent explanation when they write that Obama has to respond, since chemical weapons represented his “red line” when it comes to U.S. intervention. So, if he does nothing, it encourages bad behavior from folks all over the world. But, let’s be honest, the rebels are just as brutal as Bashir al-Assad’s crew and are aligned with Al Qaeda. Why would we want them to win? And why does the U.S. have to be the global enforcer? It never turns out well. So, looking for more, the conspiracy theorist in me thinks it’s about economics. The budget deficit is smaller this year than expected, and military spending is the easiest way to goose the fiscal side and engender GDP.

-The stock market looks extremely vulnerable, with the head (of a proposed head-and-shoulders) coming together very nicely. In fact, it looks to be happening even faster than I thought. I am waiting on any short plays until the right shoulder is mature.

-As for bonds, between the war talk and a weak stock market, we should expect some useful information to be revealed on where we are in the transition from a secular bull to a secular bear – or put differently, where we are on the road to a funding crisis.

I think that hits on a lot of it.

Thursday, August 8, 2013

Optimism?

Here I am, back to tempting fate.

I sat down with the gold chart today because I thought I saw something.  And, upon further review, there might be reason for optimism.

If you'll recall, back in mid-June, I identified a bearish cup-and-handle formation that projected the gold price to about $1,200.  Soon afterwards, gold was smashed down to around $1,180.

Well, it would appear that a bullish cup-and-handle may be on the horizon.  I have provided a chart below, identifying the bearish formation from a couple of months back, and now updating it to include a bullish cup-and-(half a) handle.  If I'm right, the projection is to at least $1,500 - the support level in June, which is now overhead resistance, is about $1,340.  Given the low at $1,180, add that $160 spread to the resistance price and, voila, you have a target.

I am somewhat skeptical of technical analysis, but there have been enough occasions over time where I see a chart's pattern resolve itself right at the moment that some other news headline ends up encouraging the anticipated move.  Currently, we have low gold inventories at the Comex, tensions between Russia and the U.S., concerns about the solvency of Europe, violence in the Middle East, a more shaky Chinese economy that has been hinting at some new form of Bretton Woods, and money-printing worldwide.  The point being, that something could happen that's bullish for gold in the next few weeks, right as the handle portion is completed, suggesting that maybe it's worth keeping an eye on.

Tuesday, August 6, 2013

The Plumbing of a Tinfoil Story

Recently, Turd Ferguson noticed a pattern where gold would get smacked down in each delivery month.  Today, he expounded on what he thinks is happening - since it seems to be happening again, right on schedule.  As has been pointed out recently, GOFO rates are negative and inventories at the Comex are low, all as we hear about ravenous demand for the physical stuff.

So, the theory goes like this...

The takedowns around this time are intentional.  The bullion banks put on big naked shorts to drive the price down.  Simultaneously, as Authorized Participants, the bullion banks are able to make withdrawals of actual metal from GLD (the gold ETF) timed to coincide with the heavy selling, thereby enabling them to make good on delivery to contract holders who want to take possession.

I don't know if that's true, and there are plenty of guys who I respect who say that it isn't.  Still, even if it is, this too shall pass.  The fundamental story to drive gold higher is very compelling.  What's working against it is just the chart and crowd psychology.

Broken Money

The subtitle is Why Our Financial System is Failing Us and How We Can Make it Better , and the author is Lyn Alden (2023). I feel like I hav...