Showing posts with label Government Data. Show all posts

Thursday, January 10, 2019

"Truth to Power!!!"

I am anything but a fan of Donald Trump, still I am among the few in my social circle who doesn’t suffer a level of derangement at the mere mention of his name.  Hence, the irony in my title to this post.  Nevertheless, I am happy to point out when he is lying or wrong.  In his pursuit of China, his consternation with their trade policies, IP theft, and other misgivings is justified.  But, his response is misguided, and, more specifically, his interpretation of the data is exaggerated.  In George Magnus’ book Red Flags, one particular data point often volleyed around is clarified to the President’s detriment:

“Yet, this $370 billion US trade deficit with China is not all strict bilateral trade, because China, as Asia’s prime supply chain hub, finishes off a lot of products shipped there by, say, Japan and South Korea.  According to the value-added trade data of the Organization for Economic Co-operation and Development (OECD), which allows for this sort of effect, the US trade deficit with China was just $150 billion in 2017, and once you allow for the US surplus in services, the total deficit was about $110-$120 billion.  This doesn’t mean the Americans don’t have legitimate arguments about Chinese trade and investment practices, but it is important to bear this in mind in assessing the bluster that often passes as trade policy.”

Thursday, March 16, 2017

Hangover

One of the interesting data points that I came across post-election is that over the past 100 or so years, following any two-term President, there has always been an economic contraction within the first twelve months afterwards.  In that vein, I saw a really compelling interview with Lacy Hunt on Real Vision that provided the following nuggets:

As it relates to debt:
     -From 1952-1999, it took $1.70 of debt to produce $1 of GDP
     -From 2000-2015, it took $3.30 of debt to produce $1 of GDP
     -In 2016, it took $5.00 of debt to produce a $1 of GDP

That, my friends, is what non-productive investment and debt looks like.  But, there's more...

-The United States is demographically challenged.  The population is the oldest that it has been at any time in the history of the republic.

-As a post-script on those debt and GDP correlations, the last 10 years has only seen an average of 1% per capita income growth, far below historical trends.

-The post-GFC recovery has been the weakest expansion since WW2, and one of the weakest since 1790.

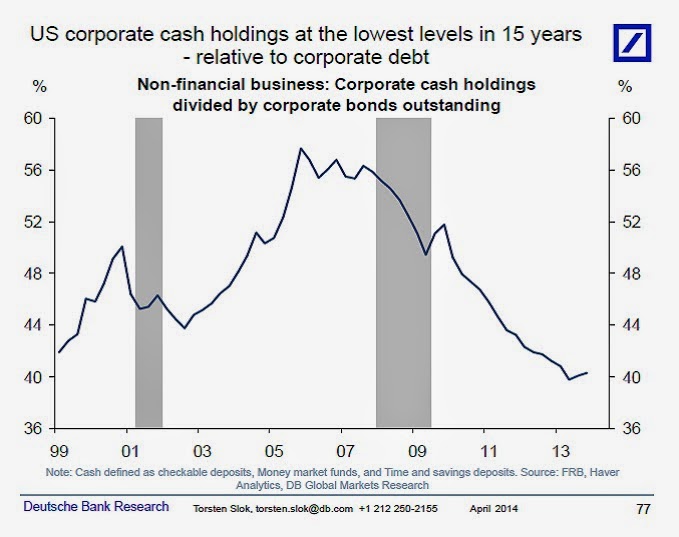
-The industrial capacity use rate has been trending down, which speaks to significant excess capacity.  That represents one of the strongest rebuttals to the idea that the proposed corporate cash repatriation plan will have meaningful impacts on growth.

-Of the $69Tn in outstanding debt in this country, some $20Tn is due in the next two years.  As rates are now 100bps higher than a year ago, that represents some $200Bn in additional debt service payments if all of those liabilities are simply re-financed.  In an economy where GDP only grew by $530Bn last year, more and more capital therefore has to go towards financial/non-productive overhead.

Anyway, all of it is just a roundabout way of saying that things look bleak for the economy prospectively.  And why, despite my disgust with Putin Derangement Syndrome and liberal hypocrisy, I am not a big believer in the Trump rally and related economic confidence.  Even if he does the right things, the bill is still coming due.

Friday, December 2, 2016

More Sign Posts

Despite that 4.6% headline national unemployment rate, an interesting chart from VP Research which shows that now 40% of states have rising unemployment.  Not a good trend.


More on that Economic Boom

Courtesy of the folks at Zero Hedge, we know that over the last three months, the U.S. has gained 638,000 part-time jobs and lost 99,000 full-time jobs.  But, by all means, the stock market should be going gangbusters, and the media should be putting out articles like this...

Enough

I finished up David Stockman’s latest bible-sized rant, Trumped! A Nation on the Brink of Ruin…And How to Bring It Back (2016).  While spending the first 50 pages hitting on the economic realities that enabled an outsider like Trump to make his run at the Oval Office (the book ends after the party conventions but before the election), the remaining 400+ pages are a re-visit of the author’s very strong views on Keynesian central bank policies, beltway war hawks, and fiscal waste in Washington – all topics that were examined in his last book.

With that said, there were some data points that I thought useful for future dinner parties.  To wit (one of Stockman’s favorite terms, by the way):

-Since 2000, there are 5 million more prime working Americans and not one has a job, and the number of households receiving means-tested benefits has doubled to 100 million.

-Total credit market borrowings by households was $14.2Tn in 2007 and stands at $14.3Tn now.  Maybe Richard Koo is right.

-Since 2000, real capital consumption has increased by 53% while real net investment is down by 17%.

-Business debt has increased since the eve of financial crisis from $10Tn to $12.5Tn, but it's gone towards non-productive ends like stock buybacks, LBOs and financial engineering.

-In speaking to the financialization of the economy, since 1987 the value of debt and equity securities have moved from 2.4x to 5.4x GDP.

-We have $3Tn of imported goods and services and $10Tn of consumption.  That seems like a good place to tax, rather than payroll and corporate income.

-Since 2010, there have been $360Bn in auto sales, but there has also been a surge in auto loans of $355Bn.

-The recent pronouncement that the social security trust fund is solvent until 2034 is premised on the entirely unrealistic assumption that the US economy will grow by 5.1% per year for the next 12 years.  The pace of GDP growth since 2000 has been 3.8%, and it's been at a reduced 2.8% growth rate over the last seven years and 3.3% over the last four.

-80% of the highly-traveled bridges in need of repair sit in California, mostly in the greater Los Angeles area.  Sounds like CA taxpayers should be responsible, not all Americans through some enormous infrastructure program.

-60% on new debt issuance in China in recent years has gone to pay interest.

As a closing thought, I don’t think that I need to read another one of his books.  Over 1,200 pages later, I get the point.

Tuesday, November 8, 2016

Tick Tock...

I sounded "sad" in yesterday's post, but really I am pretty sanguine about the election.  Change is going to come even if the status quo candidate wins today -- and it's going to happen because we can't escape the debt problem in this country.  So, to explore the issue a bit, I put together a table of annual U.S. fiscal deficits and the cumulative changes in total outstanding public federal debt since 1960.  I think it brings home the point.  Enjoy.


Year Deficit Public Debt Fed
1960 4.8 290.5
1961 10.5 292.7
1962 7.2 302.9
1963 4.8 310.3
1964 5.9 316.1
1965 1.4 322.3
1966 3.7 328.5
1967 8.6 340.5
1968 25.2 368.7
1969 (3.2) 365.8
1970 2.8 380.9
1971 23.0 408.2 Bye-bye gold standard…notice anything about deficits afterwards?
1972 23.4 435.9
1973 14.9 466.3
1974 6.1 483.9
1975 53.2 541.9
1976 73.7 629.0
1977 53.7 706.4
1978 59.2 776.6
1979 40.7 829.5
1980 73.8 909.0
1981 79.0 994.8
1982 128.0 1,137.3
1983 207.8 1,371.7
1984 185.4 1,564.6
1985 212.3 1,817.4
1986 221.2 2,120.5
1987 149.7 2,346.0
1988 155.2 2,601.1
1989 152.6 2,867.8
1990 221.0 3,206.3
1991 269.2 3,598.2
1992 290.3 4,001.8
1993 255.1 4,351.0
1994 203.2 4,643.3
1995 164.0 4,920.6
1996 107.4 5,181.5
1997 21.9 5,369.2
1998 (69.3) 5,478.2 Clinton "Surpluses", but federal debt grows $400Bn…hmmm
1999 (125.6) 5,605.5
2000 (236.2) 5,628.7
2001 (128.2) 5,769.9
2002 157.8 6,198.4
2003 377.6 6,760.0
2004 412.7 7,354.7
2005 318.4 7,905.3
2006 248.2 8,451.4
2007 160.7 8,950.8
2008 458.6 9,986.1
2009 1,412.7 11,875.9
2010 1,294.4 13,528.8
2011 1,299.6 14,764.2
2012 1,087.0 16,050.9
2013 679.6 16,719.4
2014 484.6 17,794.5
2015 438.4 18,120.1 Federal Debt grows $1.4Tn…hmmm
2016 587.4 19,537.4


Monday, October 31, 2016

More on the "Legacy"

I came across an article by Bob Murphy looking at some of the claims in the third presidential debate, and trying to offer some rebuttals to the immediate criticisms that were engendered.  That's an introduction to what I read, because in reality I don't really care about that part of it.  What I did find interesting is where he offers a basic retort to all the people who think our economy is anything better than anemic.  Specifically:

"However, Trump was not wrong for suggesting that the U.S. should have enjoyed—at least temporarily—growth rates of even 8 percent in the wake of the Great Recession, if indeed the government (and Federal Reserve) had enacted sound policies. Historically, the U.S. economy rebounded very strongly after a bad recession, at least partially making up for the lost output of the previous downturn...

Since the ostensible recovery began in the summer of 2009, only rarely has year-over-year U.S. real GDP growth bounced above 2.5 percent, and it has centered around 1.5 percent.

In stark contrast, going all the way back to World War II, GDP growth following a recession soared, albeit just briefly. Look, for example, at the early 1980s. In the first quarter of 1984, real GDP was 8.6 percent higher than it had been a year earlier.

The disparity in recovery growth rates is even more alarming when we consider that the depth of the Great Recession exceeded that of any other recession in the postwar era...

If the rhetoric from Obama and Clinton partisans were correct—namely, that the Great Recession had been caused by awful Republican policies which were fixed under Democratic rule—then we would have seen at least a few quarters of very high economic growth. Yet we have seen no such thing."

Thursday, October 13, 2016

Job Story

An interesting read on the Obama "boom".  In particular, this chart tells a story that the media often glosses over:

Sunday, May 22, 2016

Sanity Check

Courtesy of FiveThirtyEight:

When Hillary Clinton laid out her economic vision for her prospective presidency in a speech last July, she made sure to work in a shoutout to her husband’s economic record as president. “The results speak for themselves,” Clinton said. “Under President Clinton — I like the sound of that — America saw the longest peacetime expansion in our history.”

Now Clinton is doubling down on that message. On Sunday, she told voters in Kentucky that she would put her husband “in charge of revitalizing the economy” because “he knows how to do it.” Aides subsequently told The New York Times’ Amy Chozick that the former president would more specifically focus on parts of the country that are struggling.

Whatever Bill Clinton’s exact role in a Hillary Clinton administration would be, it’s no surprise that she is looking to tie herself to his economic legacy. Bill Clinton’s second term was the last time the U.S. economy was unequivocally strong; for most voters this November, it was the best economy they’ve ever known. But while Hillary Clinton wants voters to look back fondly on the first Clinton presidency, she should hope they don’t remember too much about what happened next.

The economy at the end of Bill Clinton’s term was really, really good. In 2000, the final year of his presidency, the unemployment rate dropped below 4 percent for the first time in three decades, while the share of adults that were working hit an all-time high. Wages rose steadily. The stock market soared. The budget deficit turned into a surplus. Inflation, much to the surprise of many economists, stayed under control.

Perhaps most importantly, the late 1990s were a period of shared prosperity. The strong labor market drove up wages for workers throughout the earnings ladder, while drawing in people who traditionally struggle to find work, such as convicted felons and the disabled. The racial wealth gap narrowed. Inequality continued to rise, but families of all income levels saw gains.

The bursting of the tech bubble in 2000, and the subsequent recession, revealed that the 1990s boom was, at least to some degree, a mirage, the result of cheap money and, in then-Fed Chairman Alan Greenspan’s famous phrase, “irrational exuberance.” The recession that followed the tech bust, however, was relatively mild. If that were the worst consequence of the Clinton era, it might seem a small price to pay for a decade of solid growth.

But the Clinton boom, and even some specific Clinton policies, also helped sow the seeds for the far more severe Great Recession of the late 2000s. Mortgage-backed securities and subprime loans weren’t invented in the 1990s, but they expanded greatly during the period, part of a broader “financialization” of the U.S. economy that contributed directly to the severity of the Great Recession. Critics on the right argue Clinton-administration policies promoting increased lending to low-income and minority applicants contributed to the subsequent bubble; critics on the left, including Bernie Sanders, argue that Clinton’s deregulation of the banking industry paved the way for the crisis.

Bill Clinton deserves, at most, a small sliver of the blame for the financial crisis. But he probably doesn’t deserve much credit for the late-’90s boom, either. The reality is, presidents have at best limited influence over the economy. Clinton’s economic policy was determinedly centrist: modest tax increases, free trade (including the signing of the North American Free Trade Agreement) and limited government regulation and spending (the latter due in part to the Republican Congress). Those policies no doubt affected the economy, for good or bad. But their impact pales in comparison to that of forces beyond Clinton’s control: the rise of the internet, the entrance of the baby boomers into their peak earning years, the “peace dividend” that came from the fall of the Soviet Union.

It is a stretch, then, for Hillary Clinton to argue that her husband — or anyone else — “knows how” to ensure a good economy. But there are still lessons to take from the late 1990s. Most importantly, that low unemployment is crucial to generating wage gains for low-income workers — and that a period of such low unemployment need not lead to runaway inflation. The surest way to create an economy that works for everyone is to make sure that anyone who wants one can have a job.

Tuesday, May 10, 2016

The False Narrative

Per David Sikora:

The availability of financial information and "new economy" companies created intense upward pressure on stocks from all sectors as the world ushered in a new millennium. Between 1994 and 2000, the Dow Jones industrial average exploded from 3,834 to 10,786, while the Nasdaq jumped from 751 to over 4,000. Over the same period, the value of shares traded on the New York Stock Exchange increased nearly fivefold, from $2.45 trillion to $11.06 trillion, though even it paled in comparison to the value of shares traded on the Nasdaq, which grew ninefold from $1.45 trillion to $20.40 trillion.

The flurry of stock trading that took place over this period created sizable short- and long-term capital gains, delivering the windfall that led to the federal government's budget surplus. These were unusual circumstances that political leaders just happened to be in the right place at the right time to oversee — not the result of a coordinated set of policies implemented by the Clinton administration, or by elected officials from either party for that matter.

As the presidential campaign season heats up, we will undoubtedly hear candidates advocate higher taxes on American citizens, arguing that greater taxation on productivity will not drive behavioral change but will inexorably bring the country back to the golden age of budget surpluses we enjoyed when Clinton was in the White House. But without an innovation as profound as the Internet, higher taxes on Americans — who themselves are often job creators — could be more of a dangerous drag than surefire solution for the U.S. economy.

Monday, August 4, 2014

On Q2 GDP

“Of this 4% increase, the change in real private inventories added 1.66%. In other words GDP based on goods and services actually sold was only 2.34%. That changes in unsold goods, which is what inventories represent, should be part of final consumption is a dubious proposition…”

-Alasdair Macleod

Friday, May 23, 2014

Internet Reads

-After finishing the Coyle book, it was amusing to read how Italy is trying to boost GDP by now including prostitution and illegal drug sales in its calculation.

-Poof. Did you catch that? That was America’s energy independence disappearing like a fart in the wind.

Thursday, May 22, 2014

GDP

The subtitle is A Brief But Affectionate History and the author is Diane Coyle (2014).

Another short-ish read on an interesting topic. The history of GDP speaks to its politicized nature. Its current conception evolved in the 1940s as a way for the government to measure national income in a time of depression and war, but also as a way to inflate it over previous definitions by including government spending in its calculus. Regardless of whether it was truly for productive ends.

So, on the one hand, we have the Keynesian/fiscal largesse folks using it to show growth by pushing for government spending. On the other hand, you have the MMT/NGDP Targeting contingent pushing for central bank interventions to create growth, as if the appearance of a higher nominal number (regardless of whether it is all inflation-driven) foretells of good times. And there is some correlation there – higher GDP prints are typically coincident with lower unemployment and better times. But, as the book speaks to, in a very deferential way, what GDP measures is not necessarily what matters most. It struggles with technological innovation, does not handle the service sector very well (certainly overstating the relevance of the financial sector), and therefore can mask bubble phenomena beneath the surface.

But, for now, it is still viewed as the best alternative to measure economies and to provide a basis for comparison across countries.

Wednesday, May 7, 2014

Obamacare and Jobs

Courtesy of John Mauldin, I read an interesting piece by Rich Yamarone at Bloomberg that does a good job of explaining how weak payroll reports should be viewed as an anticipated symptom of Obamacare.

Under the health care law, if an employee works more than 30 hours per week an employer has to offer coverage. So when you parse through the jobs data and see that the biggest increases have come in the retail and hospitality sectors, suddenly it makes sense. A restaurant chain has a lot of employees and does not want to incur that insurance expense – so they reduce weekly hours to less than 30 per employee, and make up for it by hiring more people, while still saving on the bottom line because they fall within the ACA exemption. Simultaneously, without these new low-paying jobs, the payroll reports would look a lot more dismal.

Basically, don’t misconstrue the “strong” job growth.

Friday, May 2, 2014

Follow His Lead

The other day I posted a presentation from Kyle Bass and emphasized his comments on Japan. Even earlier in the video, he talked about the U.S. and mentioned the problems in front of Yellen, by virtue of tying the Fed Funds rate to unemployment levels – specifically, given the way the U.S. calculates it unemployment rate, the 5.5% bogey might be hit very soon, even as the economy remains in the toilet.

Lo and behold, a big "upside" surprise in the NFP today dropped the rate from 6.6% to 6.3%. But, on the heels of a very bad Q1 GDP print, and with an NFP report that was really pretty lousy beneath the surface, Mr. Bass seems to be on the money again.

As for that payroll report, I defer to Zero Hedge to enumerate all the problems:

-More people dropping out of the labor force

-Bad results for workers aged 25 to 54

-Since February 2010, workers have been dropping out of the labor force at a faster pace than jobs have been created

Etc, etc...

Wednesday, April 30, 2014

Interesting Things

-Thank goodness for Obamacare. Whoever said “G” isn’t important to national output?!

-I liked this FRBNY chart (h/t Marc Faber):


-I’ve said it before, I’ll say it again. You can’t just look at the asset side of the balance sheet…


-This is what a “failed rally” looks like… (h/t Fleck)


-“Every act of conscious learning requires the willingness to suffer an injury to one’s self-esteem. That is why young children, before they are aware of their own self-importance, learn so easily; and why older persons, especially if vain or important, cannot learn at all.” –Thomas Szasz (h/t Marc Faber)

-“…agonies notwithstanding, I do not believe in mistakes. I believe that we all go through some very bad experiences and that the only mistake we can make is to fall down and to stay down.” – Marc Faber

Wednesday, January 1, 2014

2014

I had to go back and remind myself of the quick list of predictions that I made for 2013. Overall, not a stellar job. Gold is still in a bull market, but it also suffered horribly over the last 12 months. Japan showed the early signs of what I deem to be big problems, but there was no obvious combustion. There was a taper, despite my best guess, and the unemployment rate moved lower (even if everyone now knows it is a bad measure of success). But, shorting the yen was definitely a winner.

On to 2014…

I think the same themes that I focused on then are in play. We have just moved 12 months closer to the point when everyone else will start to realize it.

-Japan keeps approving more “stimulus” because Abenomics does not do anything except weaken the yen and create cost-push inflation. Wages are stagnant.

-Gold has tested the 2013 low a few times. We’ll know shortly, I think, whether that will hold or $1,000 to $1,100 is the landing spot. Either way, a good value exists in the metal and the better mining stocks. Still,  I anticipate that 2014 will be much more generous to the gold bulls than the past two years have been.

-The 10-year closed above 3.00%. That can’t make the Fed happy and is a clear measure of how the bond market is no longer cooperating. Higher rates are bad for housing prices, the stock market, budget deficits, profit margins and all the things that create a desired wealth effect.  So, with all of it, I don’t think the Taper is the thing.

-Finally, on a personal note, I expect my endeavors in real estate to evolve.

A happy and healthy new year to all.

Tuesday, November 26, 2013

(Sigh)

It’s 10 days old and continues to receive attention, so now it’s my turn.

Mr. Krugman is at it again, commenting on a recent presentation by Larry Summers at the IMF Research Conference. Summer’s attention-grabbing and provocative conclusion is that the U.S. has basically been in a secular stagnation since the 1980s. The source of stagnation could be demographics, a decline in innovation or something else – but the key point is that bubbles have become necessary in order for the economy to grow.

Krugman, as usual, is careful to talk with caveats and in measured language, but it’s clear that he finds much merit in the position, ultimately concluding “What Larry did at the IMF wasn’t just give an interesting speech. He laid down what amounts to a very radical manifesto. And I very much fear that he may be right.”

But let’s dig in to some of the commentary before we get there. For starters, Krugman the Statist implies that government spending is better than private spending. Specifically, he notes that the Keynes' hypothetical of burying currency in holes for the private sector to dig up, or Krugman’s notion of preparing for a fake alien invasion, are both the types of massive government spending that the economy needs right now – because spending is the priority and “unproductive spending is still better than nothing”. And the same logic applies to the private sector as well, at least sort of: ”Private spending that is wholly or partially wasteful is also a good thing, unless it somehow stores up trouble for the future. That last bit is an important qualification.” Huh? Is he really suggesting that the risk only lies with the private sector when the mandate is just to spend?  I don't really think the facts support that, but it sure does tell us a lot about the mindset behind the Krugman schtick, and why he often supports programs that take control away from individuals and centralizes it in Washington.

Another area where his position just glosses over the facts is in arguing that with all the bubbles since the S&L crisis, there really has been no inflation. And to agree you basically have to ignore financial assets and the size of government or the persistent instability in the face of a “Great Moderation”. CPI doesn’t capture any of those things, of course – and it also ignores food and energy prices as well. But, by all means, continue with your hedonics and substitution, forget about wage stagnation, and pretend that people can afford just as much, and you still end up with a CPI (bogus as it may be) that is more than 2.5 times higher than it was in the late 80s.

Krugman also says the problem is not loose money and low rates.  If anything, if Summers is right, the economy has been trying to get into a liquidity trap for a long time, and but-for high household spending and increasing debt, things would probably look much worse.  I find it a bit misleading then to ignore the shift from a gold standard to an unbacked currency, and the resulting spike in debt levels since then, with an attending decrease in the bang that you get from each incremental dollar of debt, and still to conclude that monetary policy is not related here.

Anyway, to wrap this up, Krugman offers some ideas for how to handle this new reality. Like paying negative interest rates on deposits, pushing inflation much higher, and worrying less about financial regulation since we really need to encourage bubbles. Some of which we’ve heard before, maybe once or twice. And which I’m sure will all turn out wonderfully. After all, Nassim Nicholas Taleb is banking on it.

Broken Money

The subtitle is Why Our Financial System is Failing Us and How We Can Make it Better , and the author is Lyn Alden (2023). I feel like I hav...