The move in interest rates since the election (and really since the low over the summer) has been impressive. There are a whole host of unintended consequences if rates move higher in a world where the stock market is overvalued, economic growth is tepid, debt is in large supply already, and the spigots of fiscal policy seemed poised to be turned on under Trump.
So, with that as context, I decided to look at the charts to determine whether it is safe to say that the 35-year bull market is over. Short answer, until the 10-year bond (as proxy for all bonds) cracks north of 3%, then the downtrend in rates remains intact. With that said, the double bottom (hit almost exactly 4 years apart in 2012 and 2016) speaks to a potential change of course. But, we must wait for confirmation, especially as there are plenty of smart people that I follow who are making the case for even lower rates when the next recession hits.
Showing posts with label Chart Formations. Show all posts
Friday, November 18, 2016
Wednesday, April 30, 2014
Interesting Things
-Thank goodness for Obamacare. Whoever said “G” isn’t important to national output?!
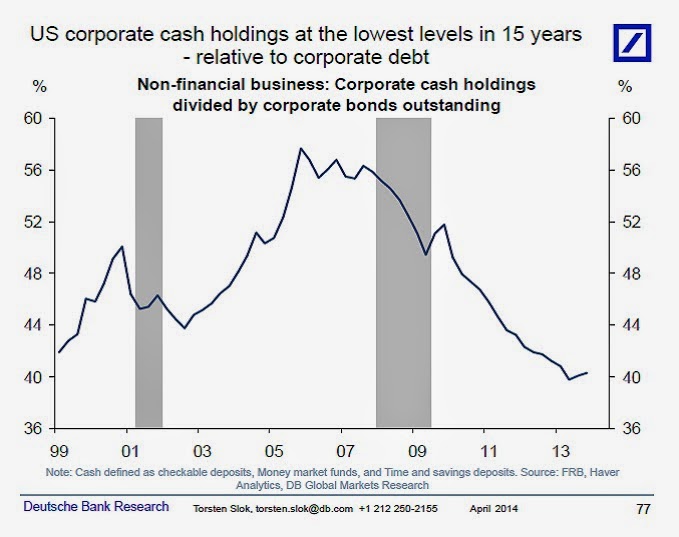
-I liked this FRBNY chart (h/t Marc Faber):
-I’ve said it before, I’ll say it again. You can’t just look at the asset side of the balance sheet…
-This is what a “failed rally” looks like… (h/t Fleck)
-“Every act of conscious learning requires the willingness to suffer an injury to one’s self-esteem. That is why young children, before they are aware of their own self-importance, learn so easily; and why older persons, especially if vain or important, cannot learn at all.” –Thomas Szasz (h/t Marc Faber)
-“…agonies notwithstanding, I do not believe in mistakes. I believe that we all go through some very bad experiences and that the only mistake we can make is to fall down and to stay down.” – Marc Faber
-I liked this FRBNY chart (h/t Marc Faber):
-I’ve said it before, I’ll say it again. You can’t just look at the asset side of the balance sheet…
-This is what a “failed rally” looks like… (h/t Fleck)
-“Every act of conscious learning requires the willingness to suffer an injury to one’s self-esteem. That is why young children, before they are aware of their own self-importance, learn so easily; and why older persons, especially if vain or important, cannot learn at all.” –Thomas Szasz (h/t Marc Faber)
-“…agonies notwithstanding, I do not believe in mistakes. I believe that we all go through some very bad experiences and that the only mistake we can make is to fall down and to stay down.” – Marc Faber
Sunday, April 27, 2014
Friday, April 11, 2014
Next in the queue...
Gold.
After tackling the currencies earlier, we now look at my favorite metal from the table of elements. I have never been a guy who focused on Fibonacci retracements, but, holy moly, does the gold chart confirm that analysis lately. First, here’s the chart (using GLD as a proxy):
Let me explain what’s going on. I have connected the trough of $114.46 on 12/31/13 with the peak of $133.69 on 3/14/14 – represented by the white, hashed line. Off of that, I have added Fibonacci fan lines (the dark blue lines), which measure the important Fibonacci retracement levels of 38.2%, 50.0%, 61.8% and 100.0%. What you’ll observe is that the correction from March 14th until April 1st matches perfectly with the 38.2% level. More specifically, the green arrow highlights where the 38.2% level lies – and in drawing a horizontal line from that point, you’ll see that the correction ended exactly at that price.
Pretty remarkable. And probably a decent sign that the near-term correction in gold was over.
As an afterthought, the light blue lines show the Fibonacci retracement levels for the move up off the April 1st low, and they suggest that we could be getting close to the next short-term pause in the price action.
After tackling the currencies earlier, we now look at my favorite metal from the table of elements. I have never been a guy who focused on Fibonacci retracements, but, holy moly, does the gold chart confirm that analysis lately. First, here’s the chart (using GLD as a proxy):
Let me explain what’s going on. I have connected the trough of $114.46 on 12/31/13 with the peak of $133.69 on 3/14/14 – represented by the white, hashed line. Off of that, I have added Fibonacci fan lines (the dark blue lines), which measure the important Fibonacci retracement levels of 38.2%, 50.0%, 61.8% and 100.0%. What you’ll observe is that the correction from March 14th until April 1st matches perfectly with the 38.2% level. More specifically, the green arrow highlights where the 38.2% level lies – and in drawing a horizontal line from that point, you’ll see that the correction ended exactly at that price.
Pretty remarkable. And probably a decent sign that the near-term correction in gold was over.
As an afterthought, the light blue lines show the Fibonacci retracement levels for the move up off the April 1st low, and they suggest that we could be getting close to the next short-term pause in the price action.
FX Trades
I don’t pay as much attention to the markets these days – but when I do, my focus is primarily on rates, forex and gold. Today we’ll hit on some currencies because they present interesting trades on a regular basis, with the ability to use options on ETFs in order to implement ideas and manage risk.
First up is the Euro. I saw this article about how Draghi and ECB members are getting worried about deflation, with the single currency getting stronger against the US Dollar. Arguably the ECB has been the least aggressive in its monetary policy and, as a result, the Euro is up near 1.40 (after being as low as 1.275 last August). Which is why I fully expect some action in the next few months, consistent with the piece from Bloomberg. And why I think it is time to get positioned with some puts on the FXE.
Next is the Yen. I posted a few weeks ago about a cup-and-handle in the chart, foretelling Yen weakness ahead. Given the difficulties that Abenomics has had in achieving its goal. I fully anticipate more JGB purchases by the BOJ. Even the chart suggests that the Yen is at support levels and unlikely to get much stronger from here. My play is to purchase puts on the FXY.
Clearly both trades would suggest dollar strength ahead. And while the Dollar Index has been getting hammered lately, it’s approaching levels that have functioned as support in the past.
First up is the Euro. I saw this article about how Draghi and ECB members are getting worried about deflation, with the single currency getting stronger against the US Dollar. Arguably the ECB has been the least aggressive in its monetary policy and, as a result, the Euro is up near 1.40 (after being as low as 1.275 last August). Which is why I fully expect some action in the next few months, consistent with the piece from Bloomberg. And why I think it is time to get positioned with some puts on the FXE.
Next is the Yen. I posted a few weeks ago about a cup-and-handle in the chart, foretelling Yen weakness ahead. Given the difficulties that Abenomics has had in achieving its goal. I fully anticipate more JGB purchases by the BOJ. Even the chart suggests that the Yen is at support levels and unlikely to get much stronger from here. My play is to purchase puts on the FXY.
Clearly both trades would suggest dollar strength ahead. And while the Dollar Index has been getting hammered lately, it’s approaching levels that have functioned as support in the past.
Thursday, January 9, 2014
Gold Update
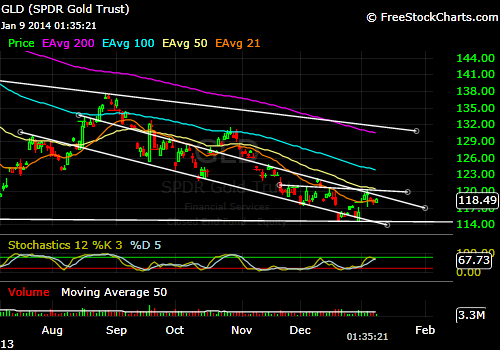
I haven’t dwelled on the chart for gold in a while, so here goes…
What I have provided below is the last 6 months for GLD. I see two things that are worth paying attention to. First, observe the downward sloping channel that dates back to August, 2013. It has been a decent gauge for where to buy and sell, and just this past week operated as overhead resistance on price. Second, I drew in a short horizontal line that starts in late November, 2013. It appears to function as the neckline for an inverse head-and-shoulders – if I’m right, then what we need to watch for in coming days is price stabilization around these levels ($117 to $119) and then an attempt to retest the $120 level. If it were to break through, the move should take us up to the $125 level or so – all of which would be significant because of the bullish inverse head-and-shoulders being completed, but also because it would mean a breakout from the channel discussed earlier.
If the question is where do I stand? I am agnostic, but constructive on where price is headed. You know what to look at.
What I have provided below is the last 6 months for GLD. I see two things that are worth paying attention to. First, observe the downward sloping channel that dates back to August, 2013. It has been a decent gauge for where to buy and sell, and just this past week operated as overhead resistance on price. Second, I drew in a short horizontal line that starts in late November, 2013. It appears to function as the neckline for an inverse head-and-shoulders – if I’m right, then what we need to watch for in coming days is price stabilization around these levels ($117 to $119) and then an attempt to retest the $120 level. If it were to break through, the move should take us up to the $125 level or so – all of which would be significant because of the bullish inverse head-and-shoulders being completed, but also because it would mean a breakout from the channel discussed earlier.
If the question is where do I stand? I am agnostic, but constructive on where price is headed. You know what to look at.
Tuesday, October 22, 2013
The Long Game
I want to expand on my last post because I finally feel like something clicked with respect to gold and where it’s headed. Let’s review:
-In a post on October 11th, I looked at gold on a daily chart (each candlestick represents one day’s price action). My view was that a cup-and-handle was in play, with the cup spanning from early May to late August. The handle piece was still not confirmed and needed to set up in a hurry in order to be viable. But, if it happened, the overhead resistance level would be $1,420 and projected to somewhere around $1,700.
-Within that post, and acknowledging the possibility that a low was not yet in, I suggested an alternative theory that the cup was really a left shoulder and part of a larger bottoming formation that could span well into 2014. Again, the neckline would be $1,420, but the bottom had yet to be found. Still, borrowing from Jim Rogers and others who think it could go as low as $900 to $1,000, the projected target would be something like $1,800 to $1,900.
-Enter today’s thinking. On an even longer time frame, where we look at price in terms of weeks instead of days, the chart is suggestive of an inverse head-and-shoulders about halfway through, this time with $1,800 as the key level of overhead resistance. But, by virtue of the larger scope, the target would be significantly higher. If the price had found a bottom at roughly $1,200, then the minimum projection would take us to $2,400. But, again, accepting Jim Rogers’ rough forecast and using $1,000 as an eventual trough, the new projected target could be at least $2,600. In this scenario, we are talking about a pattern that is apt to take another 18 to 24 months to resolve.
What am I going to do about it?
-The key is to watch the $1,420 level, which is less than $100 away as I write. A break above and I’m playing a move towards $1,700. And any pullback along the way should produce higher lows and a trend line will inevitably develop that one could to use to trade in and out. Or you might just buy some long-dated out-of-the-money calls with the break of $1,420.
-If the cup-and-handle doesn’t materialize, then we are probably headed lower. Without an instinct to where the fall would stop, $1,000 seems like as good a forecast as any, so I’m buying when we get there. Again, probably some LEAPS and I’m giving myself enough time to let the head on both the weekly and daily charts play out. I’m selling them when we get back above $1,700.
So far, either scenario seems to bring us to the same place as far as selling this initial trade.
-Once we get up to the $1,700 to $1,800 level, a correction of some depth will come as the right shoulder develops. My expectation is that the support will exist between $1,500 and $1,600. And the right shoulder itself should take 9 to 12 months to form, bottoming out somewhere in the middle of that period. And if I’m smart enough to see it, I will again consider adding to physical and LEAP positions at around that level.
-Now it’s time to see the bottoming formation complete itself. And it probably says 2015 on the calendar as that happens. But then the fireworks begin.
(Breathe.)
Obviously, this could all be moot. But, if I’m wrong, it doesn’t really matter yet, because I’m not going to do anything right now. But, if I’m right – and I kind of have to believe that if I’m convinced that the bull market will continue – then all of the above seems reasonable. And, to bring Jim Rogers back to the discussion, a cup-and-handle or an inverse head-and-shoulders, all within an even larger inverse head-and-shoulders, taking place over 3 or 4 years… well, that sure sounds like a “complicated bottoming process”.
-In a post on October 11th, I looked at gold on a daily chart (each candlestick represents one day’s price action). My view was that a cup-and-handle was in play, with the cup spanning from early May to late August. The handle piece was still not confirmed and needed to set up in a hurry in order to be viable. But, if it happened, the overhead resistance level would be $1,420 and projected to somewhere around $1,700.
-Within that post, and acknowledging the possibility that a low was not yet in, I suggested an alternative theory that the cup was really a left shoulder and part of a larger bottoming formation that could span well into 2014. Again, the neckline would be $1,420, but the bottom had yet to be found. Still, borrowing from Jim Rogers and others who think it could go as low as $900 to $1,000, the projected target would be something like $1,800 to $1,900.
-Enter today’s thinking. On an even longer time frame, where we look at price in terms of weeks instead of days, the chart is suggestive of an inverse head-and-shoulders about halfway through, this time with $1,800 as the key level of overhead resistance. But, by virtue of the larger scope, the target would be significantly higher. If the price had found a bottom at roughly $1,200, then the minimum projection would take us to $2,400. But, again, accepting Jim Rogers’ rough forecast and using $1,000 as an eventual trough, the new projected target could be at least $2,600. In this scenario, we are talking about a pattern that is apt to take another 18 to 24 months to resolve.
What am I going to do about it?
-The key is to watch the $1,420 level, which is less than $100 away as I write. A break above and I’m playing a move towards $1,700. And any pullback along the way should produce higher lows and a trend line will inevitably develop that one could to use to trade in and out. Or you might just buy some long-dated out-of-the-money calls with the break of $1,420.
-If the cup-and-handle doesn’t materialize, then we are probably headed lower. Without an instinct to where the fall would stop, $1,000 seems like as good a forecast as any, so I’m buying when we get there. Again, probably some LEAPS and I’m giving myself enough time to let the head on both the weekly and daily charts play out. I’m selling them when we get back above $1,700.
So far, either scenario seems to bring us to the same place as far as selling this initial trade.
-Once we get up to the $1,700 to $1,800 level, a correction of some depth will come as the right shoulder develops. My expectation is that the support will exist between $1,500 and $1,600. And the right shoulder itself should take 9 to 12 months to form, bottoming out somewhere in the middle of that period. And if I’m smart enough to see it, I will again consider adding to physical and LEAP positions at around that level.
-Now it’s time to see the bottoming formation complete itself. And it probably says 2015 on the calendar as that happens. But then the fireworks begin.
(Breathe.)
Obviously, this could all be moot. But, if I’m wrong, it doesn’t really matter yet, because I’m not going to do anything right now. But, if I’m right – and I kind of have to believe that if I’m convinced that the bull market will continue – then all of the above seems reasonable. And, to bring Jim Rogers back to the discussion, a cup-and-handle or an inverse head-and-shoulders, all within an even larger inverse head-and-shoulders, taking place over 3 or 4 years… well, that sure sounds like a “complicated bottoming process”.
The Longer View
Unfortunately the right side (price) got cut off, but below is gold on a weekly basis going back to June, 2011 (i.e., it includes the spike to $1,900 per ounce).
I don't have much to say, except that maybe we are halfway through the head in an inverse head-and-shoulders. The neckline is $1,800. The trough is $1,200. It will probably take another a year or two to complete, but it projects to north of $2,400. And if you marry it to my other recent analysis, which is more short-term and looks at the potential cup-and-handle that could be another inverse head-and-shoulder within the larger one on the weekly, all you're doing is setting up an even higher target.
Friday, October 11, 2013
Beatdown, Part...Oh, who the hell cares at this point?!
Another beatdown in gold today, triggered by a huge, sloppy market order. I want to believe that the tinfoil contingent is crazy, but with more and more trades like this one, that show a blatant disregard for price, it’s becoming difficult. Anyway, in the aftermath, I thought that looking at the chart would be useful. Below is a daily that takes us back to the first big dump in April.
My read is that a bullish cup-and-handle formation is on the table, but first we have to see an intermediate bottom put in here. There is not much wiggle room on that either. Around these levels is where it needs to bounce if it’s going to.
On the other hand…
Consistent with guys like Jim Rogers who think we are in for a lower low and a longer bottoming process, what looks like a cup today could become a left shoulder down the road. All of which would suggest a process of bottoming that takes us well into 2014, if not 2015. And under those circumstances, the inverse head-and-shoulders would be simply massive and speak to an incredibly powerful upside move. We would just need to show some patience.
My read is that a bullish cup-and-handle formation is on the table, but first we have to see an intermediate bottom put in here. There is not much wiggle room on that either. Around these levels is where it needs to bounce if it’s going to.
On the other hand…
Consistent with guys like Jim Rogers who think we are in for a lower low and a longer bottoming process, what looks like a cup today could become a left shoulder down the road. All of which would suggest a process of bottoming that takes us well into 2014, if not 2015. And under those circumstances, the inverse head-and-shoulders would be simply massive and speak to an incredibly powerful upside move. We would just need to show some patience.
Friday, October 4, 2013
What vs. Why
The team at Casey Research posted an interesting conversation with a technical analyst, Dominick Graziano. He was the guy who helped them to create the GLD put insurance trades that worked well for their subscribers earlier this year.
In the course of talking about all markets, gold came up of course. His view is that it remains in a significant downtrend – and, therefore, news that should be bullish simply won’t be as impactful versus what might have happened to the price in 2010. He also notes that the charts suggest that global equities entered into a secular bull market earlier this year, one that may last for several more years.
All of which brings me back to the problem that I have with TA. In looking at the “What” of price action, the charts don’t ever give you the full story. As I like to say, Enron’s chart looked great, until it didn’t. And such will be the case, in my opinion, with everything else right now. For example, it seems that there is a huge disconnect between the fundamentals of the underlying economy and stock market performance. There is also the problem of a bull market in bonds that appears to be near completion (if not over already) – and higher interest rates are not going to be good for stocks. And, lastly, if much of the stock market levitation is attributable to money-printing, which I believe, then it’s hard to have any confidence that the trend is secular and still has years to go, especially if people start to figure out how the Fed is trapped in its policies.
The fundamentals matter. Which means the “Why”. And since charts are often looking in the rearview mirror in establishing a trend, they can miss the realities distorted outside of a candlestick.
In the course of talking about all markets, gold came up of course. His view is that it remains in a significant downtrend – and, therefore, news that should be bullish simply won’t be as impactful versus what might have happened to the price in 2010. He also notes that the charts suggest that global equities entered into a secular bull market earlier this year, one that may last for several more years.
All of which brings me back to the problem that I have with TA. In looking at the “What” of price action, the charts don’t ever give you the full story. As I like to say, Enron’s chart looked great, until it didn’t. And such will be the case, in my opinion, with everything else right now. For example, it seems that there is a huge disconnect between the fundamentals of the underlying economy and stock market performance. There is also the problem of a bull market in bonds that appears to be near completion (if not over already) – and higher interest rates are not going to be good for stocks. And, lastly, if much of the stock market levitation is attributable to money-printing, which I believe, then it’s hard to have any confidence that the trend is secular and still has years to go, especially if people start to figure out how the Fed is trapped in its policies.
The fundamentals matter. Which means the “Why”. And since charts are often looking in the rearview mirror in establishing a trend, they can miss the realities distorted outside of a candlestick.
Wednesday, October 2, 2013
Gold Update
I could very well be whistling past the graveyard, but here goes an updated take on the gold chart (as is often the case, using GLD as proxy).
First thing to note is that between yesterday and today, it strongly bounced off of a shorter-term trend line that dates back to early July. However, even though an equivalent wouldn't emerge in the actual gold chart (since it is 24 hours), the move back up today simply closed the gap in the GLD chart that yesterday’s action had created. So, obviously we need more information in order to know what it all means.
But, taking the broader view of the past 6 months (which is what the entire chart captures), you’ll notice the line drawn in that dates back to the first dump in April – and here’s where maybe I’m trying to be too cheerful – it could be interpreted as the neckline of a large inverted head-and-shoulders formation. Which would suggest that yesterday’s levels should hold and that we could expect the next move up to re-test that neckline.
At the same time, there is a sound thinking which holds that bear markets, such as the one that gold has experienced in the past two years, don’t reverse themselves in a V-shaped manner (which is what the July low would suggest). Instead, it takes time and muddling through the lower levels as a new base is formed.
Again, I don’t know. I have been wrong at most junctures. But, if it’s any consolation, the theory also holds that even the most adamant bulls begin to question themselves when the real bottom gets formed. From what I’ve been reading here and there, it kind of feels like that is starting to happen.
First thing to note is that between yesterday and today, it strongly bounced off of a shorter-term trend line that dates back to early July. However, even though an equivalent wouldn't emerge in the actual gold chart (since it is 24 hours), the move back up today simply closed the gap in the GLD chart that yesterday’s action had created. So, obviously we need more information in order to know what it all means.
But, taking the broader view of the past 6 months (which is what the entire chart captures), you’ll notice the line drawn in that dates back to the first dump in April – and here’s where maybe I’m trying to be too cheerful – it could be interpreted as the neckline of a large inverted head-and-shoulders formation. Which would suggest that yesterday’s levels should hold and that we could expect the next move up to re-test that neckline.
At the same time, there is a sound thinking which holds that bear markets, such as the one that gold has experienced in the past two years, don’t reverse themselves in a V-shaped manner (which is what the July low would suggest). Instead, it takes time and muddling through the lower levels as a new base is formed.
Again, I don’t know. I have been wrong at most junctures. But, if it’s any consolation, the theory also holds that even the most adamant bulls begin to question themselves when the real bottom gets formed. From what I’ve been reading here and there, it kind of feels like that is starting to happen.
Thursday, September 19, 2013
Headed Towards Intrinsic Value
Interesting day in currency land. Not surprisingly, the dollar has collapsed, breaking through important support levels. But the Yen is very weak also. Maybe people are switching horses and moving from the juiced Nikkei back to the S&P, since Bernanke is promising even more liquidity than expected. Or maybe people are pricing in a counter-move by Abe and Kuroda, since we are in the middle of a currency war. Or maybe there is a bit of news today that I missed. Regardless, the story ends the same.
Tuesday, September 17, 2013
Tea Leaves
Like the moth attracted to a flame. When it comes to gold, and trying to read the chart, I can’t help myself – even though every time I offer an opinion lately, I get burnt. Be that as it may, and in spite of a just posted comment where I throw my hands in the air about what’s coming, I am going to read the squiggles.
Below you’ll find two charts: (1) gold priced in US Dollars and (2) gold priced in Japanese Yen. In both, it appears that gold is at important levels.
First up, dollars. At a bit over $1,300 per ounce, the bulls would like to see it hold, otherwise we’re probably headed back to the late-June lows. On the other hand, if it does hold, you might notice the downward sloping line that I drew in that traces back to the dump in April. Again, if the price holds, you see what could arguably be described as an inverse head-and-shoulders, which is suggestive of higher prices.
Now for the Yen. It is a bit more constructive, and I have drawn three lines that are relevant. The first captures a recent peak in early September and then heads sideways to late May. If price were to hold, you have a cup-and-handle set-up in the making. Which leads to my other doodles. The price of gold is currently hitting the intersection of two supportive trend lines. One that is moving northeast from late-June and the other which runs sideways from early-April. Since gold is not operating below these support lines (as is the case with the USD chart), it makes a stronger case for bullish price action from here.
Which leads to my pairs trade idea. Buy gold, short Yen using GLD calls and FXY puts. A thought, not a suggestion or advice.
Below you’ll find two charts: (1) gold priced in US Dollars and (2) gold priced in Japanese Yen. In both, it appears that gold is at important levels.
First up, dollars. At a bit over $1,300 per ounce, the bulls would like to see it hold, otherwise we’re probably headed back to the late-June lows. On the other hand, if it does hold, you might notice the downward sloping line that I drew in that traces back to the dump in April. Again, if the price holds, you see what could arguably be described as an inverse head-and-shoulders, which is suggestive of higher prices.
Now for the Yen. It is a bit more constructive, and I have drawn three lines that are relevant. The first captures a recent peak in early September and then heads sideways to late May. If price were to hold, you have a cup-and-handle set-up in the making. Which leads to my other doodles. The price of gold is currently hitting the intersection of two supportive trend lines. One that is moving northeast from late-June and the other which runs sideways from early-April. Since gold is not operating below these support lines (as is the case with the USD chart), it makes a stronger case for bullish price action from here.
Which leads to my pairs trade idea. Buy gold, short Yen using GLD calls and FXY puts. A thought, not a suggestion or advice.
Tuesday, August 27, 2013
Catching Up
Other than a quick book review, I’ve been negligent in my posting duties lately. Consider this one an effort to get current on what’s happening.
-From our original note on August 8th, when the price of gold was $1,312, the yellow metal has gone up 8.2%, in the face of declining markets everywhere else. And it seems that the momentum is back with the bulls. Not that we ever had any doubts, right?
-Syria appears to be a fiasco in the making. Stratfor offers a decent explanation when they write that Obama has to respond, since chemical weapons represented his “red line” when it comes to U.S. intervention. So, if he does nothing, it encourages bad behavior from folks all over the world. But, let’s be honest, the rebels are just as brutal as Bashir al-Assad’s crew and are aligned with Al Qaeda. Why would we want them to win? And why does the U.S. have to be the global enforcer? It never turns out well. So, looking for more, the conspiracy theorist in me thinks it’s about economics. The budget deficit is smaller this year than expected, and military spending is the easiest way to goose the fiscal side and engender GDP.
-The stock market looks extremely vulnerable, with the head (of a proposed head-and-shoulders) coming together very nicely. In fact, it looks to be happening even faster than I thought. I am waiting on any short plays until the right shoulder is mature.
-As for bonds, between the war talk and a weak stock market, we should expect some useful information to be revealed on where we are in the transition from a secular bull to a secular bear – or put differently, where we are on the road to a funding crisis.
I think that hits on a lot of it.
-From our original note on August 8th, when the price of gold was $1,312, the yellow metal has gone up 8.2%, in the face of declining markets everywhere else. And it seems that the momentum is back with the bulls. Not that we ever had any doubts, right?
-Syria appears to be a fiasco in the making. Stratfor offers a decent explanation when they write that Obama has to respond, since chemical weapons represented his “red line” when it comes to U.S. intervention. So, if he does nothing, it encourages bad behavior from folks all over the world. But, let’s be honest, the rebels are just as brutal as Bashir al-Assad’s crew and are aligned with Al Qaeda. Why would we want them to win? And why does the U.S. have to be the global enforcer? It never turns out well. So, looking for more, the conspiracy theorist in me thinks it’s about economics. The budget deficit is smaller this year than expected, and military spending is the easiest way to goose the fiscal side and engender GDP.
-The stock market looks extremely vulnerable, with the head (of a proposed head-and-shoulders) coming together very nicely. In fact, it looks to be happening even faster than I thought. I am waiting on any short plays until the right shoulder is mature.
-As for bonds, between the war talk and a weak stock market, we should expect some useful information to be revealed on where we are in the transition from a secular bull to a secular bear – or put differently, where we are on the road to a funding crisis.
I think that hits on a lot of it.
Tuesday, August 13, 2013
Someone agrees...
Given my post yesterday, I thought this article on Zero Hedge today was interesting. It also includes the following chart:
Monday, August 12, 2013
“I see dead people…”
“Walking around like regular people…They don’t know they’re dead.”
What, oh what could I possibly be talking about?
Here is a daily chart of the S&P 500 over the last 5 months.
(Giving everyone a minute to let it sink in.)
We talk about the basics of chart formations enough at this site, so hopefully you see what I do – the makings of a head-and-shoulders formation. The left shoulder extends from late April to late June, while the head is in the process of topping off and beginning a move back down towards the neckline at around 1,580. Not a slam dunk yet, but it definitely should cause a shiver down the spine of any equity investor.
Now, let me remind you of something else. Back in mid-April, I observed that the market seemed to be running into a topping pattern reminiscent of 2000 and 2007. I noted that the process could play out over 7 months or so, putting us in September or October before it would be confirmed. So let’s do some simple math. The left shoulder took two months, the head probably has another 4 or so weeks to complete, tack on another 6 weeks for the right shoulder…and you’re right in there at the end of October.
Let me offer a story for how it all evolves. There has been much talk about a taper in September – let’s assume that the Fed tries it out, only to see the markets take a dive, completing the head pattern. So, realizing the problem, the Fed backtracks and re-institutes QE at its full payload. But, the bloom is now off the rose, so the market doesn’t take us as high before the upside momentum is lost. And there is a right shoulder. All in time for an October confirmation of an impending bear market.
I may be wrong. But you’ve been warned.
What, oh what could I possibly be talking about?
Here is a daily chart of the S&P 500 over the last 5 months.
(Giving everyone a minute to let it sink in.)
We talk about the basics of chart formations enough at this site, so hopefully you see what I do – the makings of a head-and-shoulders formation. The left shoulder extends from late April to late June, while the head is in the process of topping off and beginning a move back down towards the neckline at around 1,580. Not a slam dunk yet, but it definitely should cause a shiver down the spine of any equity investor.
Now, let me remind you of something else. Back in mid-April, I observed that the market seemed to be running into a topping pattern reminiscent of 2000 and 2007. I noted that the process could play out over 7 months or so, putting us in September or October before it would be confirmed. So let’s do some simple math. The left shoulder took two months, the head probably has another 4 or so weeks to complete, tack on another 6 weeks for the right shoulder…and you’re right in there at the end of October.
Let me offer a story for how it all evolves. There has been much talk about a taper in September – let’s assume that the Fed tries it out, only to see the markets take a dive, completing the head pattern. So, realizing the problem, the Fed backtracks and re-institutes QE at its full payload. But, the bloom is now off the rose, so the market doesn’t take us as high before the upside momentum is lost. And there is a right shoulder. All in time for an October confirmation of an impending bear market.
I may be wrong. But you’ve been warned.
Thursday, August 8, 2013
Optimism?
Here I am, back to tempting fate.
I sat down with the gold chart today because I thought I saw something. And, upon further review, there might be reason for optimism.
If you'll recall, back in mid-June, I identified a bearish cup-and-handle formation that projected the gold price to about $1,200. Soon afterwards, gold was smashed down to around $1,180.
Well, it would appear that a bullish cup-and-handle may be on the horizon. I have provided a chart below, identifying the bearish formation from a couple of months back, and now updating it to include a bullish cup-and-(half a) handle. If I'm right, the projection is to at least $1,500 - the support level in June, which is now overhead resistance, is about $1,340. Given the low at $1,180, add that $160 spread to the resistance price and, voila, you have a target.
I am somewhat skeptical of technical analysis, but there have been enough occasions over time where I see a chart's pattern resolve itself right at the moment that some other news headline ends up encouraging the anticipated move. Currently, we have low gold inventories at the Comex, tensions between Russia and the U.S., concerns about the solvency of Europe, violence in the Middle East, a more shaky Chinese economy that has been hinting at some new form of Bretton Woods, and money-printing worldwide. The point being, that something could happen that's bullish for gold in the next few weeks, right as the handle portion is completed, suggesting that maybe it's worth keeping an eye on.
I sat down with the gold chart today because I thought I saw something. And, upon further review, there might be reason for optimism.
If you'll recall, back in mid-June, I identified a bearish cup-and-handle formation that projected the gold price to about $1,200. Soon afterwards, gold was smashed down to around $1,180.
Well, it would appear that a bullish cup-and-handle may be on the horizon. I have provided a chart below, identifying the bearish formation from a couple of months back, and now updating it to include a bullish cup-and-(half a) handle. If I'm right, the projection is to at least $1,500 - the support level in June, which is now overhead resistance, is about $1,340. Given the low at $1,180, add that $160 spread to the resistance price and, voila, you have a target.
I am somewhat skeptical of technical analysis, but there have been enough occasions over time where I see a chart's pattern resolve itself right at the moment that some other news headline ends up encouraging the anticipated move. Currently, we have low gold inventories at the Comex, tensions between Russia and the U.S., concerns about the solvency of Europe, violence in the Middle East, a more shaky Chinese economy that has been hinting at some new form of Bretton Woods, and money-printing worldwide. The point being, that something could happen that's bullish for gold in the next few weeks, right as the handle portion is completed, suggesting that maybe it's worth keeping an eye on.
Friday, July 26, 2013
Charts and Stuff
-Despite not saying much recently, I never stopped paying attention to the Yen. The chart (shown below) looks to be completing a head-and-shoulders formation. To be more specific, the left shoulder tracks from February to early April of this year, the head goes from early April to mid-June, and the right shoulder has been forming since then, and now appears to be closer to its conclusion than its inception. Incrementally, it has to break below 98, then 97, then 94.5 to confirm the move. If it does all of that, the target would be somewhere back in the mid-80s yen to the dollar. And that would not be according to the script for Abenomics – because as has been pointed out by several very smart folks (including Kyle Bass), the 2% inflation target will require an exchange rate closer to 120.
-An article that delves into the recidivism prevalent in the government’s foreclosure prevention program. A highlight: “The Home Affordable Modification Program (HAMP) has worked on 1.2 million mortgage modifications since it started four years ago. Of those, more than 306,000 borrowers have defaulted again on their loans, and another 88,000 are at risk as well.”
Wednesday, July 10, 2013
Foot In Mouth Disease
Maybe I’m a glutton for punishment – because I'm about to opine on the chart for gold and mining stocks again. And what I see in both the metal and a group of miners that I follow is a bullish cup and handle (i.e., the inverse of what I saw in GLD last month before it collapsed) which would suggest a decent move up. For gold, it’s probably good for at least $80 (and potentially a bit more).
And even if I didn’t see it, I would still argue that there is a big gap in the GLD chart (from 6/20/13) that needs to be closed before the next downswing should start. That gap is not closed until $130.38 gets hit, or about $85 bucks higher from here in the spot price. That fits a bit too perfectly.
Friday, June 21, 2013
Open Shorts
I have been looking for the market to go down for a while. The past few days therefore have seemed like an important change in validating that view. It would be nice to say that I had some huge shorts on. I don’t. At the moment, I am short the 10-year JGB and Santander (NYSE: SAN). The former is about the eventual funding crisis, which looks to be hitting Japan first. The latter is about a weak Europe, a weak banking system, and finally a weak market.
My short position with SAN started about 2 months ago when the price was in the $7.20s. I have provided the chart below to show what’s been happening. Back then, I thought I saw a head-and-shoulder formation in the making, that was in the process of defining the right side. Over the past handful of sessions, it appears that that formation has completed itself, signaling a big whoosh down to come. It is literally right at support, with a substantial air pocket underneath.
Subscribe to:
Posts (Atom)
Broken Money
The subtitle is Why Our Financial System is Failing Us and How We Can Make it Better , and the author is Lyn Alden (2023). I feel like I hav...
-
In his most recent post , Michael Pettis explains the problem of investment misallocations and too much debt, simply yet brilliantly (his po...
-
Are when the contrarian should think about buying. And so I tried. Some AUY LEAPS (filled) and a small mining services company that I like...
-
I am reading another book right now by economist Richard Koo, innovator of the balance sheet recession concept. If you remember what his id...