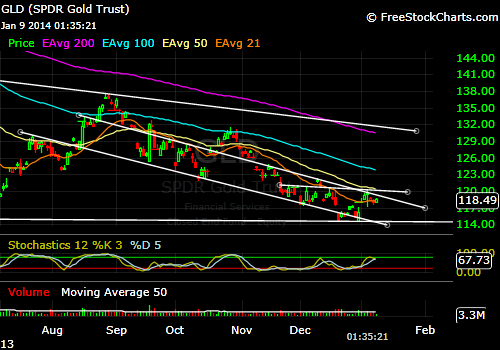
What I have provided below is the last 6 months for GLD. I see two things that are worth paying attention to. First, observe the downward sloping channel that dates back to August, 2013. It has been a decent gauge for where to buy and sell, and just this past week operated as overhead resistance on price. Second, I drew in a short horizontal line that starts in late November, 2013. It appears to function as the neckline for an inverse head-and-shoulders – if I’m right, then what we need to watch for in coming days is price stabilization around these levels ($117 to $119) and then an attempt to retest the $120 level. If it were to break through, the move should take us up to the $125 level or so – all of which would be significant because of the bullish inverse head-and-shoulders being completed, but also because it would mean a breakout from the channel discussed earlier.
If the question is where do I stand? I am agnostic, but constructive on where price is headed. You know what to look at.